


















How to Demonstrate the Return on Training Investment
When leadership questions the training budget, most L&D teams have exactly one number to hand back: completion rate. It's the wrong number for that conversation. Demonstrating real return on investment takes different metrics, and the reporting infrastructure to gather them consistently.
The completion rate trap
A 92% completion rate is a pleasant statistic. It tells a finance director almost nothing about what changed. The question they're actually asking is different: what did this training deliver for the business?
Completion rate measures participation. Participation doesn't guarantee change. An employee can watch every module, pass every quiz, collect the certificate, and go back to their old habits the next morning. A sales team can finish an objection-handling course at 100%, and field performance can look identical three months later. When L&D reporting stops at completion, leadership keeps treating training as a discretionary cost rather than an investment.
- Participation metrics: how many people started, how many finished, and how long it took them on average.
- Impact metrics: whether behaviour, performance or a business outcome actually moved afterwards.
Blend the two together in one report and the whole report loses credibility. The ROI conversation only starts once the second group is on the table — the first just sets the stage.
Metrics that prove ROI
Proving real ROI takes three metric families: skills gap closure, recruitment and retention impact, and correlation with business outcomes. Each answers a different question, and together they tell the full story.
- Skills gap closure: measured through a competency assessment before and after training. The target is "capability moved from X to Y," not "course completed."
- Recruitment and retention impact: shorter onboarding time, lower first-year attrition, higher rates of internal promotion. A well-designed onboarding programme has a direct effect on how many new hires stay past year one.
- Business outcome correlation: the link between sales training and win rate, or between customer service training and resolution time. Without this link, no training spend really holds up under scrutiny.
Put these three together and training stops looking like a cost centre. It starts looking like a measurable investment — L&D can say "we delivered this result," not just "we ran this course."
Completion rate proves training happened. Business outcome correlation proves it worked.
Measurement with GOLMS
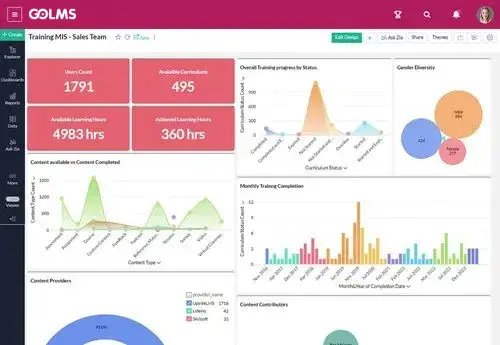
Pulling these metrics together by hand takes weeks and rarely survives scrutiny — pulling data from different systems, stitching it together in a spreadsheet, then presenting a report that's already out of date is where most L&D teams lose the most time. GOLMS's advanced analytics bring participation, competency and performance data into a single report, so nobody is reconciling spreadsheets at quarter-end.
- Segmented reporting: compare skills gap closure by department, team or role, side by side.
- Time-series analysis: track performance indicators before and after training on the same timeline.
- Executive dashboard: a one-page summary written in business language, not LMS terminology, ready for leadership.
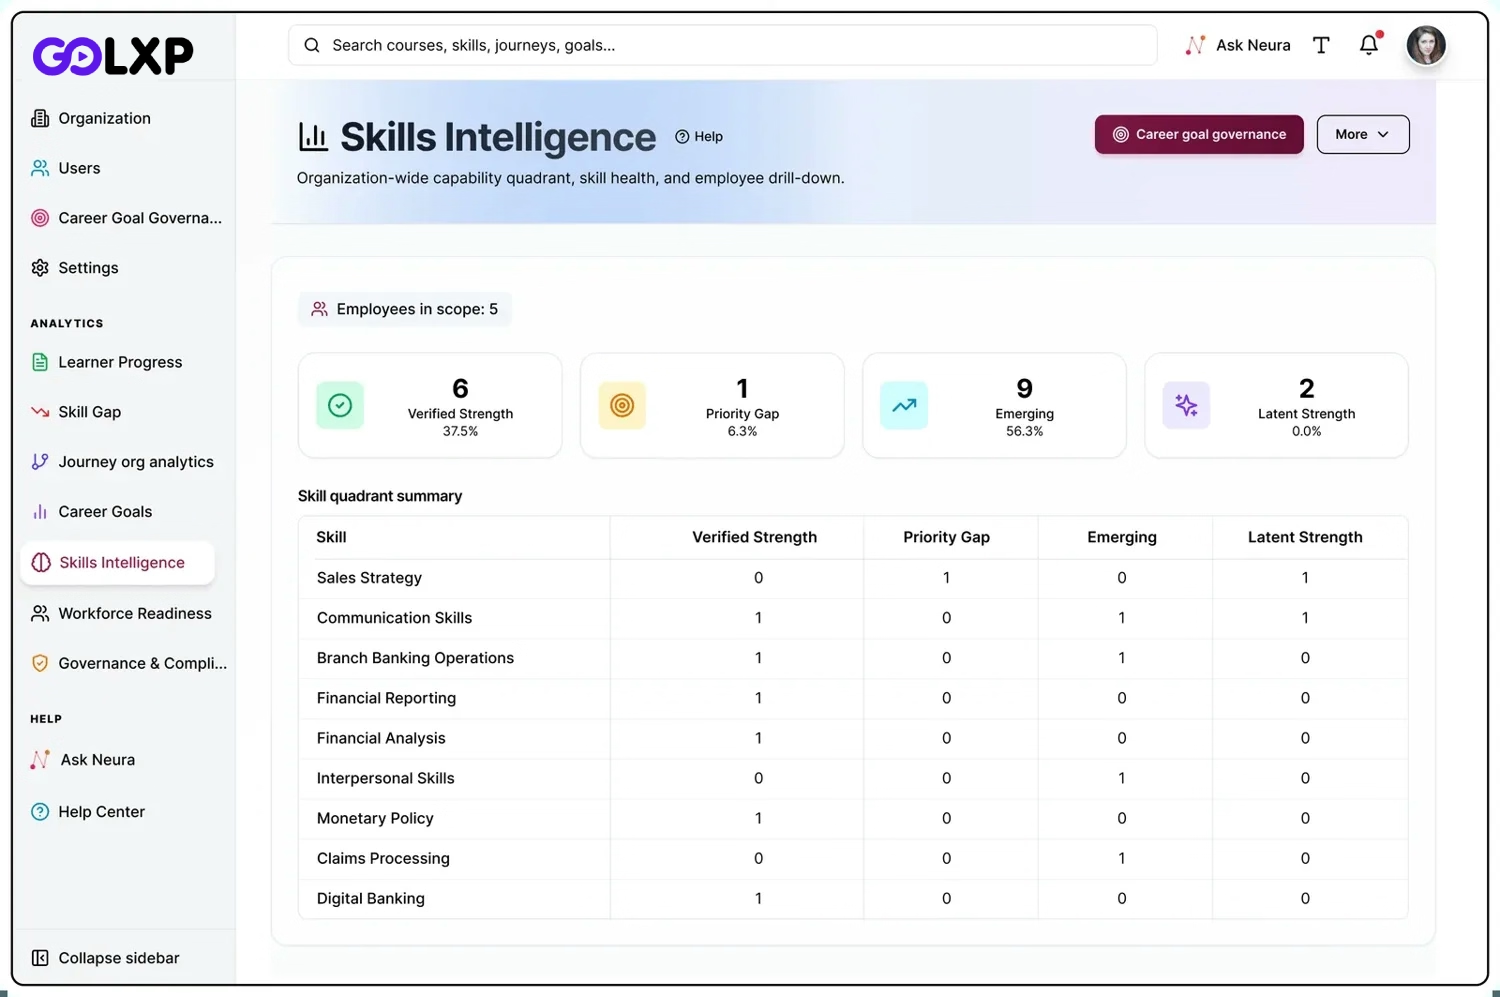
Paired with GOLXP, the link between a personalised learning path and actual skills growth becomes visible too — showing at a glance which content genuinely moved the needle, and making next quarter's investment decision easier to defend.
A practical measurement framework
Proving ROI doesn't require a complicated system. A four-step framework is enough for most L&D teams, and it can be built directly on top of an existing GOLMS setup.
- 1. Set a baseline: record competency and performance data before training begins. Without this, no comparison means anything.
- 2. Map to a business goal: tie every programme to a concrete metric — sales rate, retention, error margin, customer satisfaction.
- 3. Measure at 90 days: check for behaviour change three months out, not on the day the course ends. Lasting change only shows up on that timescale.
- 4. Report in numbers: replace "training completed" with "skills gap closed by X%, retention up Y%."
Build this framework once, and every future training budget request carries its own proof. Leadership no longer has to take L&D's word for it — the numbers make the case, and the decision gets easier. GOLMS's reporting layer turns this from a one-off exercise into a system that keeps running every quarter.